To make decisions in trading, many mathematical calculations must be performed. Skewness is one such mathematical tool that traders can employ.
If you are not familiar with statistics, you may be wondering what skewness is all about. So, without further ado, let us tell you about it.

What exactly is skewness?
Any data distribution is typically asymmetrical. Skewness is a tool for measuring asymmetry. But how do users become aware of this asymmetry? How can one tell if the data is asymmetrical?
The graph of the data can be used to determine whether it is symmetrical or not. When neither side of the distribution has mirror images, the data is said to be asymmetrical.
Skewedness Examples
The distribution may be skewed either positively or negatively. Sometimes the distribution does not have any skewness at all. The first topic of discussion will be zero skewness or no skewness.
Zero skew.

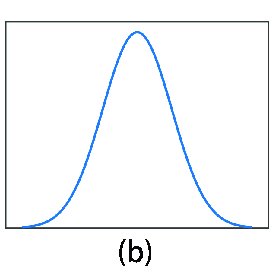
When both sides of the distribution are identical, the skewness is zero. In other words, there is no asymmetry in the distribution.
While using this to determine your trading strategy, keep in mind that even normal distribution does not have any skewness. The best way to determine the skewness of the data, however, is to plot it on the histogram.
Positive skewness

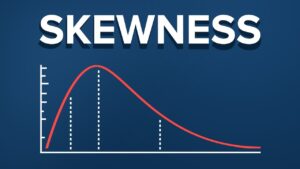
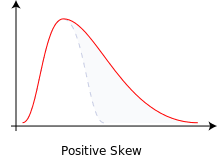
When the distribution on the right side appears long, the positive skew of the distribution becomes apparent. As a result, it is also known as the right skew.
The positively skewed distribution is distinguished by a long tail on the right side. A trader can plot the asset’s price on the histogram using the available data. It will inform him about the skewness. Then, if the distribution has a right skew, it indicates that the asset’s price has been rising during the time period under consideration.
This skewness indicates that the median is less than the mean.
skewed negatively

The negative skew, also known as the left skew, is the inverse of the positive skew. This type of skewness is distinguished by a long tail on the left side. When you combine the data from one or more assets, you will see a left-skewed distribution.
Because the prices of certain assets may rise over time. At the same time, another asset’s price could fall. The left side of a negative or left-skewed distribution will have a long tail. It will show the assets that have lost value.
The median of negatively skewed data is higher than the mean.
Skewness calculation
You can use the following formula to calculate skewness:
Median Skewness = 3 (mean-median)/ standard deviation
Skewness is a powerful tool that can inform investors and traders about the accuracy of their statistical calculations. A trader can make meaningful trading decisions based on the information obtained. It eliminates the possibility of losses.
Traders use skewness to determine the volatility. It is useful in determining whether a trade will be profitable.


